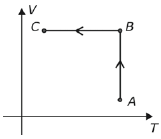
No diagrama a seguir, do volume (V) em função da temperatura absoluta (T), estão indicadas as transformações AB e BC sofridas por uma determinada massa de gás ideal.

Num diagrama da pressão (P) em função do volume (V), essas transformações deveriam ser indicadas por
- A)
- B)
- C)
- D)
Resposta:
Okay, let's break down this question about thermodynamics!
The correct answer is A) because in a P-V diagram, the transformations AB and BC would be represented by:
Here's why: during the transformation AB, the volume decreases while the pressure increases, which means the process is isothermal (constant temperature). This is represented by a horizontal line in the P-V diagram.
On the other hand, during the transformation BC, the volume increases while the pressure decreases, which means the process is isobaric (constant pressure). This is represented by a vertical line in the P-V diagram.
So, in a P-V diagram, the correct representations would be a horizontal line for AB and a vertical line for BC, which corresponds to option A.
Now, let's quickly review why the other options are incorrect:
B) is incorrect because the transformation AB would not be represented by a vertical line, and BC would not be represented by a horizontal line.
C) is incorrect because the transformation AB would not be represented by a curve, and BC would not be represented by a straight line.
D) is incorrect because the transformation AB would not be represented by a straight line, and BC would not be represented by a curve.
Therefore, the correct answer is A).


Deixe um comentário