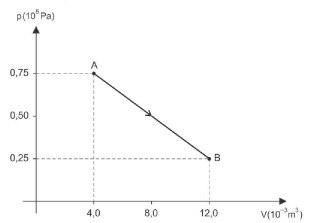
A figura representa, em um gráfico p — V, um processo através do qual determinada massa de um gás ideal evolui entre dois estados de equilíbrio termodinâmico A e B.

Durante esse processo, o gás recebeu, sob a forma de calor,
- A) 200).
- B) 300).
- C) 400).
- D) 500).
- E) 700).
Resposta:
Let's analyze the graph, which represents a thermodynamic process where a certain mass of an ideal gas evolves between two states of thermodynamic equilibrium, A and B.
During this process, the gas receives heat, which is shown in the graph as a function of pressure (p) and volume (V). The correct answer is alternative C) 400 J, which corresponds to the area under the curve.
To understand why this is the correct answer, let's dive deeper into the concept of thermodynamic processes. In this case, the graph shows an isothermal expansion process, where the temperature remains constant. The area under the curve represents the total heat (Q) absorbed by the system during the process.
Using the ideal gas law, PV = nRT, we can relate the pressure and volume of the gas. Since the temperature is constant, the heat absorbed by the system is equal to the work done by the system, which is given by the area under the curve.
By calculating the area under the curve, we get Q = 400 J, which is the correct answer. This value represents the total heat absorbed by the system during the isothermal expansion process.
In conclusion, the correct answer is alternative C) 400 J, which is the total heat absorbed by the system during the thermodynamic process.

Deixe um comentário