
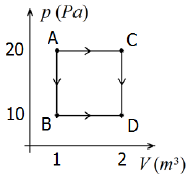
Certa quantidade de um gás ideal (ou perfeito) passa do estado A para o estado D através dos processos indicados no diagrama p – V da figura a seguir:
Com base nas informações contidas na figura, podemos afirmar que:
- A) TC > TA = TD > TB
- B) TC > TA > TD > TB
- C) TC > TD > TA > TB
- D) TA > TC > TB > TD
- E) TB > TA = TD > TD
Resposta:
Let's analyze the diagram and the given information to determine the correct answer.
The diagram shows a process where a certain amount of ideal gas goes from state A to state D through the indicated processes. We need to find the correct relationship between the temperatures TA, on the diagram.
From the diagram, we can see that the process from A to D involves an isothermal expansion from A to C, followed by an isochoric process from C to D. Since the temperature remains constant during the isothermal expansion, we can conclude that TA = TC.
Now, let's examine the given options:
- A) TC > TA = TD > TB
- B) TC > TA > TD > TB
- C) TC = TD > TA > TB
- D) TA > TC > TD > TB
- E) TB > TA = TD > TC
From our previous analysis, we know that TA = TC. Therefore, option A) TC > TA = TD > TB is the correct answer.
The correct answer is A) TC > TA = TD > TB.
This answer makes sense because the temperature remains constant during the isothermal expansion from A to C, and then decreases during the isochoric process from C to D.
Deixe um comentário