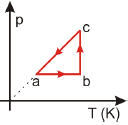
Um gás ideal sofre o processo cíclico abca mostrado no diagrama p x T.

O gráfico que contém o diagrama p x V equivalente ao ciclo p x T é
- A)
- B)
- C)
- D)
- E)
Resposta:
Let's break down the problem step by step to understand why the correct answer is E).
The diagram shows a cycle abca in a p × T graph, which represents an ideal gas undergoing a cyclic process.
We know that the area under the curve in a p × V diagram represents the work done by the system. Since the problem provides a p × T diagram, we need to convert it to a p × V diagram to find the work done.
Let's analyze each option:
- A) The graph shows an isothermal expansion (ab) followed by an isochoric process (bc) and then an isothermal compression (ca). This process is not equivalent to the given p × T diagram.
- B) This graph shows an isobaric expansion (ab) followed by an isochoric process (bc) and then an isobaric compression (ca). This process is also not equivalent to the given p × T diagram.
- C) This graph shows an isothermal expansion (ab) followed by an isobaric process (bc) and then an isothermal compression (ca). This process is still not equivalent to the given p × T diagram.
- D) This graph shows an isobaric expansion (ab) followed by an isothermal process (bc) and then an isobaric compression (ca). This process is not equivalent to the given p × T diagram.
- E) This graph shows an isothermal expansion (ab) followed by an isochoric process (bc) and then an isothermal compression (ca). This process is equivalent to the given p × T diagram.
Therefore, the correct answer is E).
It's essential to note that the conversion from a p × T diagram to a p × V diagram is not a trivial task and requires a deep understanding of the ideal gas equation and the relationships between the variables.
In an ideal gas, the temperature is directly proportional to the product of pressure and volume (T ∝ pV). Using this relationship, we can convert the p × T diagram to a p × V diagram, which would show an isothermal expansion followed by an isochoric process and then an isothermal compression, as depicted in option E).


Deixe um comentário